
Lesson 14 · Statistics
One-sample t-test
Test whether a group's average differs from a fixed value, with an effect size.
Set up
library(tidyverse)
library(rstatix)
students <- read_csv("data/students.csv", show_col_types = FALSE)
The question
Wellbeing is rated from 1 to 7, so 4 is the midpoint: neither good nor bad. At the start of semester, is students' wellbeing different from 4?
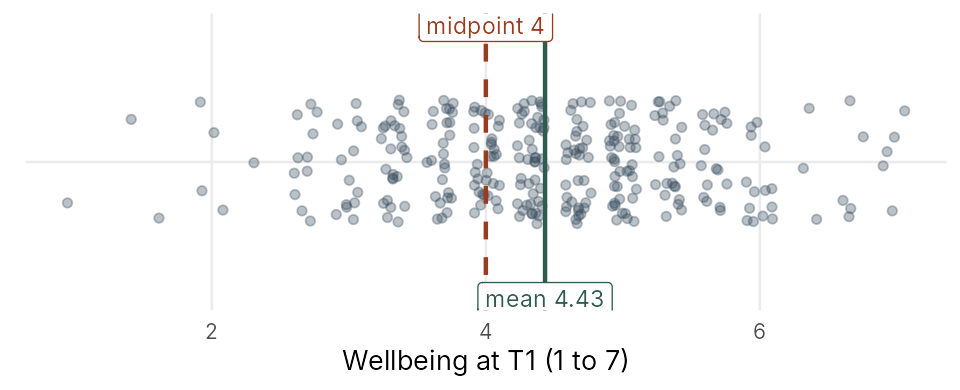
Describe first
students %>% get_summary_stats(Wellbeing_T1, type = "mean_sd")# A tibble: 1 × 4 variable n mean sd <fct> <dbl> <dbl> <dbl> 1 Wellbeing_T1 300 4.43 1.05
Run the test
Wellbeing_T1 ~ 1 means "test this one variable"; mu is the value to compare with.
students %>% t_test(Wellbeing_T1 ~ 1, mu = 4)# A tibble: 1 × 7 .y. group1 group2 n statistic df p * <chr> <chr> <chr> <int> <dbl> <dbl> <dbl> 1 Wellbeing_T1 1 null model 300 7.10 299 8.87e-12
statistic= t = 7.10. Bigger t = bigger difference relative to the spread.df= 299 (n − 1).p= 8.87e-12, far below .05: significant. Report as p < .001.
How big is the difference?
Significant doesn't mean big. Cohen's d gives the size, in SDs:
students %>% cohens_d(Wellbeing_T1 ~ 1, mu = 4)# A tibble: 1 × 6 .y. group1 group2 effsize n magnitude * <chr> <chr> <chr> <dbl> <int> <ord> 1 Wellbeing_T1 1 null model 0.410 300 small
d = 0.41: a small-to-medium effect (0.2 small, 0.5 medium, 0.8 large).
Exercises
Do students sleep enough?
Adults are advised to sleep at least 7 hours. Do students sleep a different amount from 7 hours?
- Get the mean and SD of
Sleep. - Run the t-test against 7, and get Cohen's d.
- Report it.
Show answerHide answer
students %>% get_summary_stats(Sleep, type = "mean_sd")
students %>% t_test(Sleep ~ 1, mu = 7)
students %>% cohens_d(Sleep ~ 1, mu = 7)# A tibble: 1 × 4 variable n mean sd <fct> <dbl> <dbl> <dbl> 1 Sleep 290 6.41 0.819 # A tibble: 1 × 7 .y. group1 group2 n statistic df p * <chr> <chr> <chr> <int> <dbl> <dbl> <dbl> 1 Sleep 1 null model 290 -12.2 289 5.87e-28 # A tibble: 1 × 6 .y. group1 group2 effsize n magnitude * <chr> <chr> <chr> <dbl> <int> <ord> 1 Sleep 1 null model -0.717 290 moderate
Students slept significantly less (M = 6.41, SD = 0.82) than the recommended 7 hours, t(289) = −12.22, p < .001, d = −0.72. The 10 students with no sleep answer are left out automatically, so df = 289.
Stress
Stress is rated 1 to 10, so the midpoint is 5.5. Is students' average stress different from 5.5? Report it.
Show answerHide answer
students %>% get_summary_stats(Stress, type = "mean_sd")
students %>% t_test(Stress ~ 1, mu = 5.5)
students %>% cohens_d(Stress ~ 1, mu = 5.5)# A tibble: 1 × 4 variable n mean sd <fct> <dbl> <dbl> <dbl> 1 Stress 300 5.94 1.84 # A tibble: 1 × 7 .y. group1 group2 n statistic df p * <chr> <chr> <chr> <int> <dbl> <dbl> <dbl> 1 Stress 1 null model 300 4.16 299 0.0000414 # A tibble: 1 × 6 .y. group1 group2 effsize n magnitude * <chr> <chr> <chr> <dbl> <int> <ord> 1 Stress 1 null model 0.240 300 small
Students' stress (M = 5.94, SD = 1.84) was a little above the midpoint, t(299) = 4.16, p < .001, d = 0.24: significant, but a small effect.
Key points
t_test(variable ~ 1, mu = value)compares a mean with a value.cohens_d()gives the effect size.- Report M, SD, t(df), p and d.