
Lesson 16 · Statistics
Paired t-test
Test a change in the same people from one time to another.
Set up
library(tidyverse)
library(rstatix)
students <- read_csv("data/students.csv", show_col_types = FALSE)
The question
Students who took the wellbeing workshop were measured twice: start (T1) and end (T2) of semester. Did their wellbeing change?
workshop <- students %>% filter(Workshop == "Yes")
nrow(workshop)[1] 120
Wide to long
Right now each student has one row with two columns (wide). The paired test wants one row per measurement (long).
| ID | Wellbeing_T1 | Wellbeing_T2 |
|---|---|---|
| S003 | 3.33 | 4.33 |
| S008 | 4.33 | 3.33 |
| ID | Time | Wellbeing |
|---|---|---|
| S003 | T1 | 3.33 |
| S003 | T2 | 4.33 |
| S008 | T1 | 4.33 |
| S008 | T2 | 3.33 |
workshop_long <- workshop %>%
  select(ID, Wellbeing_T1, Wellbeing_T2) %>%
  pivot_longer(cols = c(Wellbeing_T1, Wellbeing_T2),
               names_to = "Time",
               names_prefix = "Wellbeing_",
               values_to = "Wellbeing")
workshop_long# A tibble: 240 × 3 ID Time Wellbeing <chr> <chr> <dbl> 1 S003 T1 3.33 2 S003 T2 4.33 3 S008 T1 4.33 4 S008 T2 3.33 5 S009 T1 3.67 6 S009 T2 4.67 7 S010 T1 5 8 S010 T2 5.67 9 S012 T1 4 10 S012 T2 3.67 # ℹ 230 more rows
cols: the columns to stack.names_to: new column for the old column names;names_prefixtrims them toT1,T2.values_to: new column for the scores.
Run the test
workshop_long %>%
  group_by(Time) %>%
  get_summary_stats(Wellbeing, type = "mean_sd")

t_ws <- workshop_long %>% t_test(Wellbeing ~ Time, paired = TRUE)
t_ws
workshop_long %>% cohens_d(Wellbeing ~ Time, paired = TRUE)# A tibble: 2 × 5 Time variable n mean sd <chr> <fct> <dbl> <dbl> <dbl> 1 T1 Wellbeing 120 4.29 1.07 2 T2 Wellbeing 120 4.78 1.30 # A tibble: 1 × 8 .y. group1 group2 n1 n2 statistic df p * <chr> <chr> <chr> <int> <int> <dbl> <dbl> <dbl> 1 Wellbeing T1 T2 120 120 -7.73 119 3.75e-12 # A tibble: 1 × 7 .y. group1 group2 effsize n1 n2 magnitude * <chr> <chr> <chr> <dbl> <int> <int> <ord> 1 Wellbeing T1 T2 -0.706 120 120 moderate
- t = −7.73: negative because the test does T1 − T2 and T1 is lower. Wellbeing went up.
- df = 119 (pairs − 1). p < .001.
- d = −0.71: a medium-to-large change (the sign is just the direction).
ggplot(workshop_long, aes(x = Time, y = Wellbeing)) +
  geom_boxplot() +
  labs(subtitle = get_test_label(t_ws, detailed = TRUE), y = "Wellbeing (1 to 7)")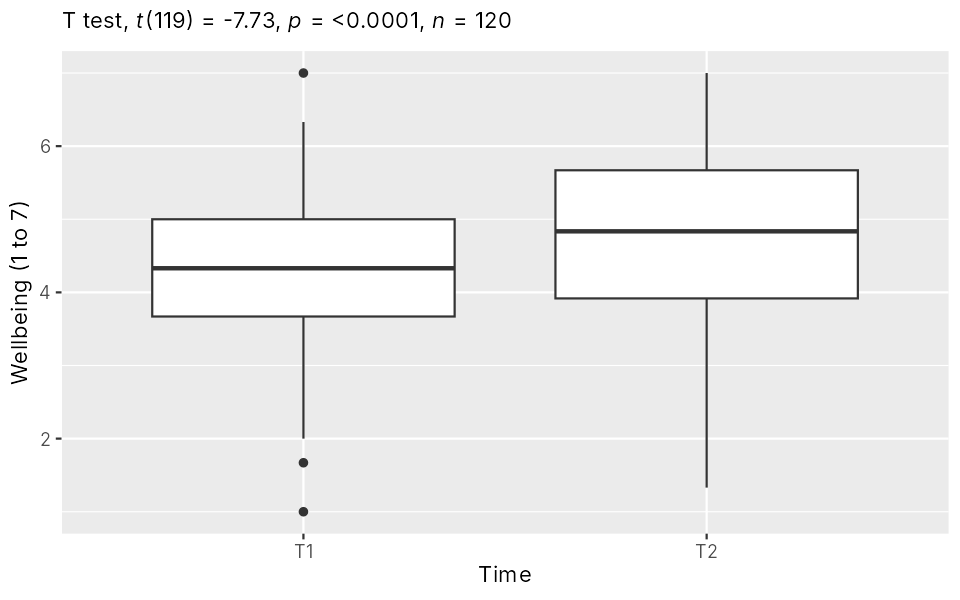
The sign of t only shows which time came first, so it's fine to drop it and say the direction in words.
Exercises
Without the workshop
Run the same paired test for students who did not take the workshop. What happened to their wellbeing?
Show answerHide answer
no_ws_long <- students %>%
  filter(Workshop == "No") %>%
  select(ID, Wellbeing_T1, Wellbeing_T2) %>%
  pivot_longer(cols = c(Wellbeing_T1, Wellbeing_T2),
               names_to = "Time", names_prefix = "Wellbeing_",
               values_to = "Wellbeing")

no_ws_long %>% group_by(Time) %>% get_summary_stats(Wellbeing, type = "mean_sd")
no_ws_long %>% t_test(Wellbeing ~ Time, paired = TRUE)
no_ws_long %>% cohens_d(Wellbeing ~ Time, paired = TRUE)# A tibble: 2 × 5 Time variable n mean sd <chr> <fct> <dbl> <dbl> <dbl> 1 T1 Wellbeing 180 4.53 1.03 2 T2 Wellbeing 180 4.34 1.31 # A tibble: 1 × 8 .y. group1 group2 n1 n2 statistic df p * <chr> <chr> <chr> <int> <int> <dbl> <dbl> <dbl> 1 Wellbeing T1 T2 180 180 3.60 179 0.000407 # A tibble: 1 × 7 .y. group1 group2 effsize n1 n2 magnitude * <chr> <chr> <chr> <dbl> <int> <int> <ord> 1 Wellbeing T1 T2 0.269 180 180 small
Their wellbeing dropped a little over the semester (t(179) = 3.60, p < .001, d = 0.27, small). Here t is positive because T1 was higher.
Why compare groups too?
Exercise 16.1 and this lesson test each group on its own. Why is the two-group test in Exercise 15.1 (change with vs without workshop) the better test of whether the workshop works?
Show answerHide answer
Wellbeing can change over a semester for reasons that have nothing to do with the workshop (exams, workload). The no-workshop students show what happens anyway. Comparing the change in the two groups separates the workshop's effect from everything else.
Key points
- Paired = the same people measured twice.
pivot_longer()reshapes wide data to long.t_test(score ~ Time, paired = TRUE); keep the pairs in order.